Portfolio Slicer workbook
Overview
Portfolio Slicer Excel workbook has in total 14 worksheets. The first 3 worksheets are src, srcSymbol, and srcTrans, and they contain multiple tables where you enter data about your investments (src comes from the word source). The other 11 worksheets contain multiple reports about your investments.

Source Worksheets
src
The src worksheet contains input tables:
It also contains system tables such as TransType, XIRR, and Report.
srcSymbol
The srcSymbol worksheet contains input tables:
srcTrans
The srcTrans worksheet contains the Transactions table.
Report Worksheets
The report side of the workbook contains these worksheets:
Dashboardworksheet - contains dashboard reports about your investments. These reports let you quickly see how your investments are doing over the last business day, month, or year.Dailyworksheet - contains reports that show how your investments changed over the last x days. Some reports show 12 days, others 20 or 30 days.Monthlyworksheet - contains reports that show how your investments changed over the last 13 months.Yearlyworksheet - contains reports that show how your investments changed over the last 5 years. Please note that yearly reports are the most time-consuming to calculate, which is why this worksheet has an additional slicerYears-Currentthat is set by default to show only current-year data. If you want to see more years of data, remove the filter from this slicer.Holdingsworksheet - contains reports about your current holdings. If you select any value in theYearorMonth In Yearslicer, then you will see holdings for that date selection.Dividendsworksheet - contains multiple reports about dividends received.Depositsworksheet - contains reports about deposits and withdrawals.TransInfoworksheet - contains reports with detailed transaction information.Salesworksheet - contains reports about sales of investments.Feesworksheet - contains reports about fees you paid on your investments.DivGenworksheet - contains reports about generated dividends.
Interacting with Portfolio Slicer reports
Most interaction with pre-built Portfolio Slicer reports should be done using Excel slicers. At the top and/or the left side of each Portfolio Slicer report worksheet you will see horizontal or vertical slicers that let you adjust the reports on that page. For example, the Dashboard page has 3 slicers: Account, ReportCurrency, and Portfolio.
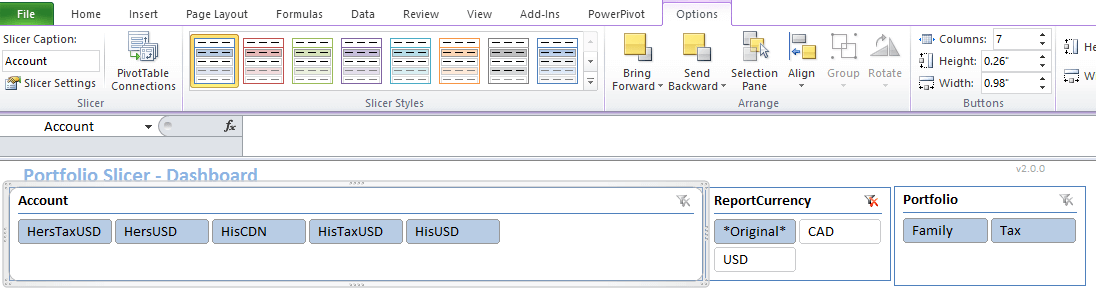
You will notice that the slicers Account and ReportCurrency are placed on every Portfolio Slicer reporting worksheet.
When the Account slicer does not have any filter applied, the reports show data for investments in all accounts. If you want to see the same reports for only one or a few selected accounts, all you have to do is select those accounts in the slicer and all reports will be recalculated for your selection.
The ReportCurrency slicer allows you to see the same report calculated in different currencies. As soon as you select any currency value, all reports on that page are recalculated by applying currency exchange rates to any investments or transactions that were done in a different currency. If you select Original currency, or no filter for this slicer, then Portfolio Slicer will not do any currency conversion. If you have all investments in one currency, then this will not cause any issues.
But if you have investments in different currencies, then reports without currency conversion will not make sense.
Practical Tips
- use slicers rather than editing report internals whenever possible
- start with the Holdings and Dashboard pages when validating a new setup
- treat
TransInfoas a useful diagnostic page when numbers look wrong - remember that some large or yearly reports may be slower to refresh than others