How to create a Portfolio Slicer dashboard in the Power BI service
Overview
You do not have to create dashboards to use Portfolio Slicer in Power BI, but dashboards are often the best way to make the reports easier to use on smaller screens.
Instead of relying only on full report pages, you can pin the visuals you care about most to a dashboard.
Why Dashboards Help
Dashboards are especially useful when:
- you want a smaller set of key metrics
- you view reports on a phone or tablet
- you want quicker access to the most important visuals
General Process
- Sign in to the Power BI service.
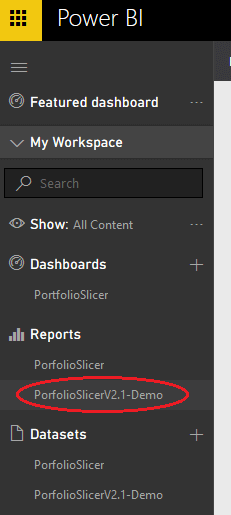
- Open the published Portfolio Slicer report.
- Open a report page.
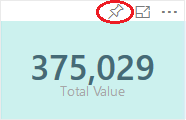
- Pin the visuals you want to a dashboard.
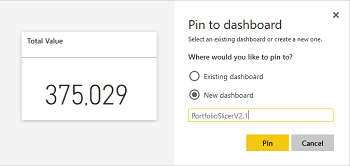
- Create a new dashboard or add the visuals to an existing one.
- Rearrange the dashboard tiles into a layout that works for you.

Practical Advice
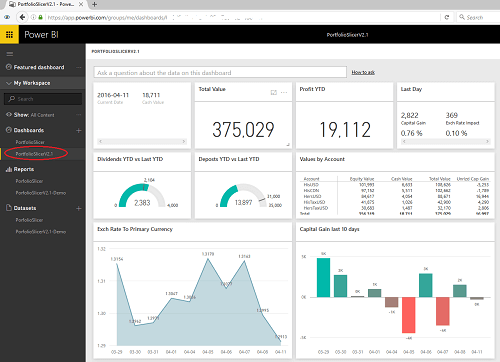
Start by pinning only a few visuals you care about most, such as:
- total value
- holdings summary
- profit or gain summary
- dividends summary
Then expand the dashboard only if the extra tiles are actually useful.