How to calculate investment yields - Capital Gain %, Dividend % and Profit %
Overview
This page explains the method used to calculate Capital Gain %, Dividend %, and Profit % in Portfolio Slicer.
It first explains how Portfolio Slicer calculates Capital Gain, Dividends, and Profit as dollar values, and then explains how the percentage values are calculated and combined over time.
Capital Gain, Dividends and Profit
Capital Gain is calculated using the formula:
Capital Gain = Investment Ending Value - Investment Starting Value - Investments during the period
Example 1:
Investment value on Dec 31, 2016 is 1000$ and on Dec 31, 2017 is 1700$, so for year 2017:
Capital Gain = 1700$ - 1000$ = 700$
Example 2:
Investment value on Dec 31, 2016 is 1000$, in March 2017 you bought additional shares for that investment worth 200$, and on Dec 31, 2017 the same investment total value is 1700$, so for year 2017:
Capital Gain = 1700$ - 1000$ - 200$ = 500$
Dividends are calculated by simply adding all dividend payments over the selected period.
Example 3:
On June 29, 2017 an investment paid 200$ dividends and on Dec 31, 2017 the investment paid 150$ dividends, so over year 2017 the investment paid in total:
200$ + 150$ = 350$
Profit is calculated by simply adding Capital Gain and Dividends, that is:
Profit = Capital Gain + Dividends
All of these calculations are simple and additive - that is, you can add values over smaller periods to get the value for a larger period. For example, if an investment pays 100$ each month in dividends, then over the year it will pay 1200$ in total dividends (100$ x 12).
Calculating yield (%) - against what value?
Calculating Capital Gain %, Dividend %, and Profit % is more complicated. To calculate these values, you would normally take Capital Gain, Dividend, or Profit over the selected period and divide it by the investment value at the start of the period:
Capital Gain % = Capital Gain / Investment Starting Value * 100%
If we go back to Example 1 above, this is easy:
Capital Gain % = 700 / 1000 = 0.7 = 70%
But Example 2 is more complicated, because additional money was invested during the period.
If we use the same simple formula, then:
Capital Gain % = 500 / 1000 = 50%
The question is what to do with the additional 200$ invested during the year. There are several possible approaches:
Ignore the additional
200$of investment. This may be acceptable if the investment was made very close to the end of the period, for example on Dec 29, 2017. Otherwise it will distort the result. Using this method,Capital Gain %stays50%.Add the additional
200$to the initial investment value. Then the formula becomes:Capital Gain % = Capital Gain / (Investment Starting Value + Investment changes during period)This may be reasonable if the additional investment was made very early in the analyzed period, for example on Jan 15, 2017. Otherwise this can also distort the result. Using this method,Capital Gain % = 500 / (1000 + 200) = 41.67%.Split the period into 2 smaller periods - one before the additional investment and one after it - calculate
Capital Gain %for each period separately, and then combine the results correctly. This is the proper way to calculateCapital Gain %, but technically it is harder to implement.
Keep in mind that investment buys and sells can sometimes have a significant impact on the calculation. You may have little, or no, investment at the start of the period and then make one or multiple large purchases or sales during the analyzed period. To reduce the impact of these external flows, it is usually better to calculate values for shorter periods and then combine them using the correct method.
Portfolio Slicer uses the second approach to calculate Capital Gain %, but to minimize the impact of external flows such as buying more or selling existing investments, the calculations are done for each month and then monthly results are linked together geometrically.
In Portfolio Slicer there is an internal measure called Compare To Value that is used as a divider in yield calculations. This measure is calculated by taking the investment value at the start of the selected period and adding deposits (if the investments include cash) or adding investment changes during the selected period.
How to add multiple period yields (%)
As described above, Portfolio Slicer calculates yield percentages monthly and then combines them to get Quarter, Year, or All Time values.
But you cannot simply add yield percentages from several periods to get the result for a larger period. They must be linked geometrically.
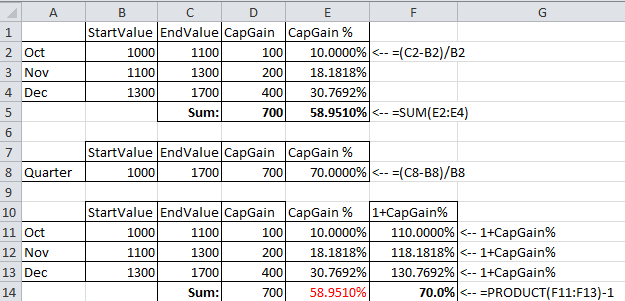
In the first table (cells A1:E5) there is Capital Gain and Capital Gain % calculation for 3 months. Investment value at the start of October is 1000$ and at the end of December is 1700$. In column D for each month, Capital Gain is 100$ in October, 200$ in November, and 400$ in December. In column E, Capital Gain % is calculated for each month. If you simply sum those monthly Capital Gain % values, the total is 58.951%.
In the second table (cells A7:E8) the same investment data is summarized at the quarter level. Investment starting value is 1000$ and ending value is 1700$. So total Capital Gain is 700$ and Capital Gain % is 70%, which is the correct value for the quarter. The reason the monthly values add up to only 58.951% is that yield percentages cannot be added directly - they must be geometrically linked.
To add yield percentages correctly, you must use the formula:
SumYield = ((1 + YieldPeriod1) * (1 + YieldPeriod2) * (1 + YieldPeriod3) * ... * (1 + YieldPeriodN)) - 1
In the third table (cells A10:F14) there is an extra column F with calculated value (1 + CapGain%), and then cell F14 uses formula =PRODUCT(F11:F13)-1 to geometrically link the monthly CapGain% values. With this method, the result in F14 becomes the expected 70%.
Portfolio Slicer calculates all yields monthly and then links those monthly results geometrically.
You can read more about geometric linking of performance results on general investment-performance sites if you want to go deeper into the math.
As noted earlier:
Profit = Capital Gain + Dividends
But the same does not work for percentage values, that is:
Profit % <> Capital Gain % + Dividends %
To calculate Profit %, Portfolio Slicer calculates monthly Profit % values and then geometrically links them.